This post is by Anand, Chief Data Scientist at Gramener
I was on vacation in December – which is a rare occurrence, since my work is such fun that I don’t need much of a vacation. But the upside of a formal vacation is that I get to switch my phone off and get several uninterrupted hours.
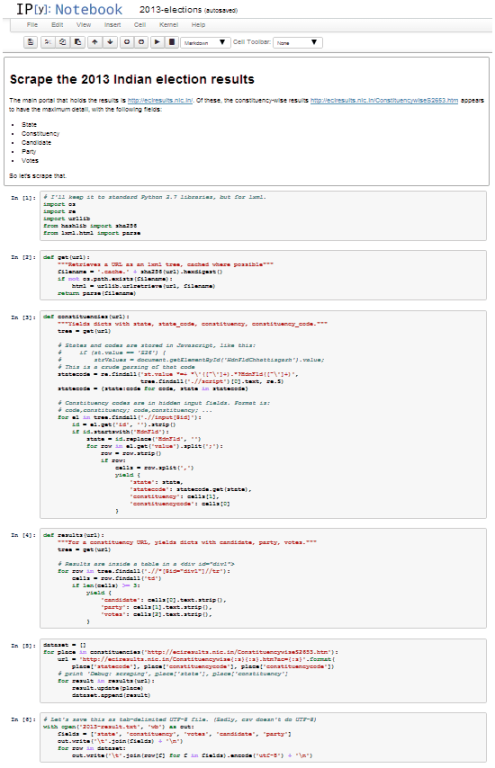
So, on Sat Dec 14 2013, after watching Men in Black III, I got bored and scraped the 2013 assembly election results from the ECI website. (My memory isn’t very good. I know the date only because I track my code on git and my movie watching on Excel.)
Unlike many other ECI pages, this one was fairly easy. You can see the code here – it’s fairly small – and I had the names, parties and votes for each of the 7,238 candidates from the 2013 elections.
The next weekend, I took a shot at scraping the election statistics page that had results for every assembly election. This was a tougher challenge by an order of magnitude. Most of the old results are in PDF files. I tried a few PDF table parsing solutions, like Tabula, but they all involved significant manual effort, or were not accurate enough.
Finally, I used xpdf to convert the PDF to text, and then parsed the text. There where a number of quirks that need to be taken into account. The detailed results, for example, start when the word “DETAILED RESULTS” are mentioned for the first time in the document. The exceptions are Goa 1989 and UP 1996. Similarly, most elections have a serial number before the name of the candidate. Some 2008-2009 elections, however, have two numbers before the name. I’ve no idea what these are.
But after a week of struggling the variations, I finally had a parser that captured all the assembly election results. All of this code and data is available on the datameet election data repository under an open license.
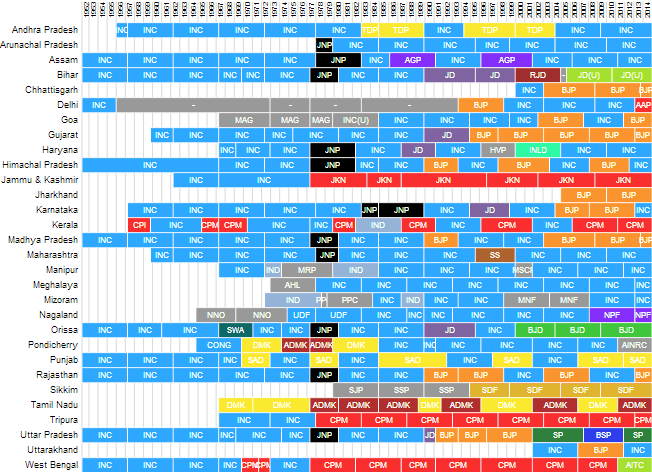
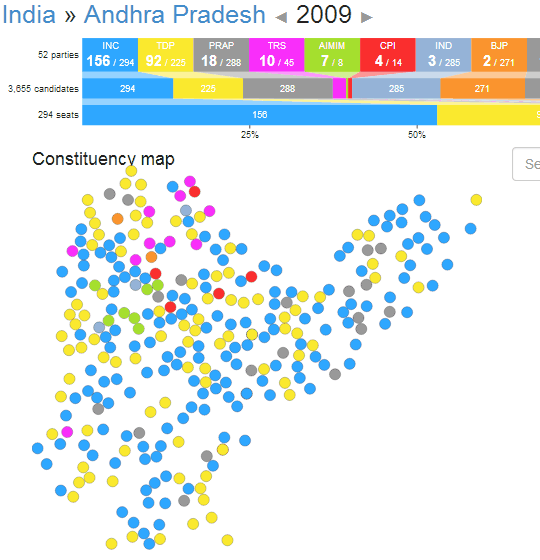
Next came the visualisation, for which I settled on this one:
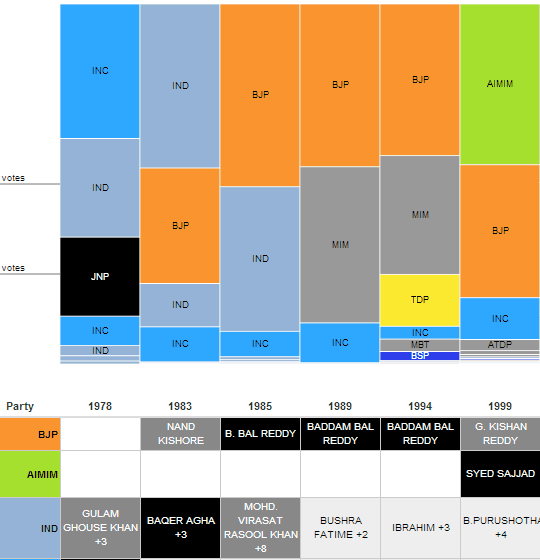
Each row shows who won the assembly elections and stayed in power for how long – effectively capturing the history of Indian assembly elections at one shot.
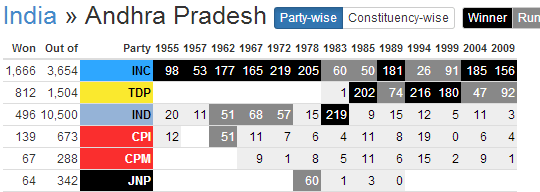
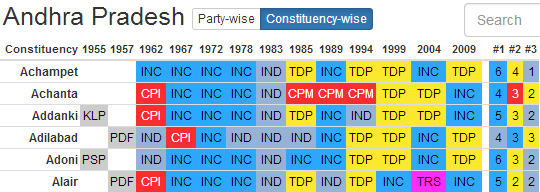
Clicking on the top level visual drills down into the details of each election, broken down in a variety of ways, answering questions such as which party has won in a given constituency, and how did it perform over time? What kind of presence does a party have in a state? What is the geographic distribution of the winning party? etc.
Over several months, this evolved into multiple branches of visualisations that you now see power the CNN-IBN Microsoft Analytics Centre and the Economic Times constituency tracker.
My favourite moment was on 7th April, on the day of the launch, when I was at the studio and ended up sneaking my way into national television (which, of course, is a lot more fun than being on it legitimately.)
At the moment, all of our public facing visuals focus on the Lok Sabha elections, but the origins were in the assembly elections, and we’ll be improving and making those visuals public as well in a few months.
The emergence of Generative AI (GenAI) is reshaping healthcare use cases and facilitating the rapid… Read More
The U.S. Food and Drug Administration's (FDA) stance on GenAI is clear: it's a groundbreaking… Read More
Executive Summary In healthcare, protecting patient information is not just a legal requirement; it's a… Read More
Demand forecasting in the supply chain is crucial for optimizing inventory levels and ensuring efficient… Read More
Hi, I am ChatGPT 3.5 Turbo. Do you know what my favorite number is? Do… Read More
After a successful webinar on digital transformation and sustainability, we organized a sequel titled “Data-Driven… Read More
This website uses cookies.
View Comments
Excellent analysis!
Brilliant work by the team. But I seriously think your Team missed on Vote Share %. It is a very important attribute and shows significant traits beyond seats. You had votes fro every seat. so you could have shown Pol-date/State/Year-Wise Vote Percent