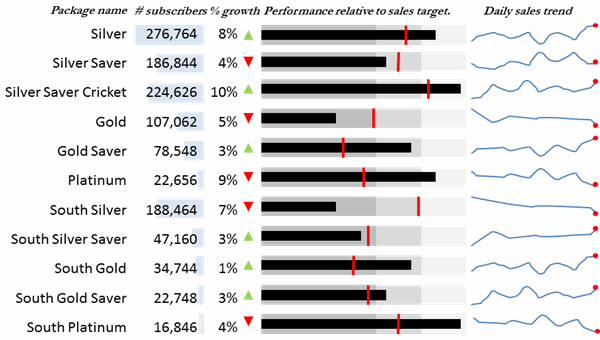
At Gramener we created a few templates that could show the performance of various channel packages offered by media companies — satellite TV companies for example.
This view shows the performance of packages relative to their sales target. It is a combination of bullet charts and spark lines. The thin black bar indicates the actual sales this month. The red vertical line indicates the target. The shades of grey show good, average or poor relative performance.
The South Silver package clearly calls for attention.
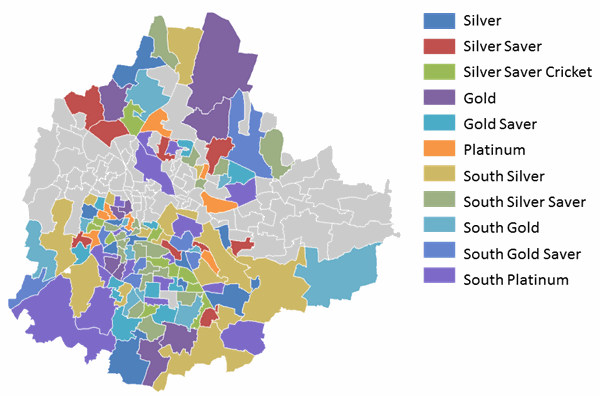
We next looked at the performance of the channels across the various parts of the city, the results are quite striking. This map shows which packages is most popular by location.
In the south-west the South Platinum package is the most popular whereas the Gold package is a hit up North. The areas in the middle from West through East the company has no sales and a potential area that calls for sales effort.
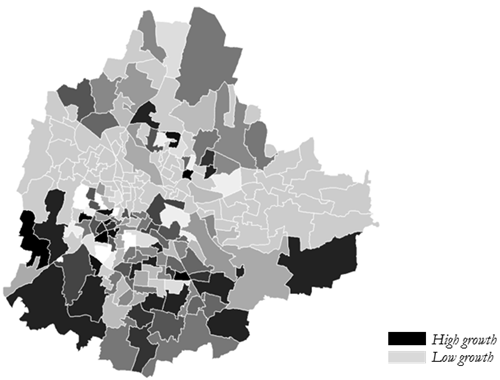
A deeper dive into the individual channels performance in terms of growth clearly provides good insight. Since growth patterns continue for a while, this may be used to direct marketing efforts at a regional level.
This visualization highlights a good case for targeting Gold saver package marketing in the south-west.
A granular geographic performance can help a lot in focusing the effort of the local sales teams and also in shifting the effort to the right areas.
The emergence of Generative AI (GenAI) is reshaping healthcare use cases and facilitating the rapid… Read More
The U.S. Food and Drug Administration's (FDA) stance on GenAI is clear: it's a groundbreaking… Read More
Executive Summary In healthcare, protecting patient information is not just a legal requirement; it's a… Read More
Demand forecasting in the supply chain is crucial for optimizing inventory levels and ensuring efficient… Read More
Hi, I am ChatGPT 3.5 Turbo. Do you know what my favorite number is? Do… Read More
After a successful webinar on digital transformation and sustainability, we organized a sequel titled “Data-Driven… Read More
This website uses cookies.
Leave a Comment